


Hello good people! Today I want to share with you a story about how our team reduced our app's bundle by 50% from its initial size with some Webpack tweaks. The points I'll be covering will hopefully be useful to you. But like with anything in this world, there is no universal solution.
Some important context 👨💻
We are a team of 6 developers, 2 of us are frontend only, 2 full-stack, and 2 backends only. When I started with this team a year ago, one of my first tasks was just to "improve performance". The only problem, this is one of those blanket terms I hate. Performance depends on so many factors;
- Loading the scripts and resources.
- The runtime speed of the app and its resource consumption.
- The backend's response time and API networking speed.
Another challenge is that the app is huge, one of the biggest and most complex frontend and backend behemoth I ever had to collaborate on. We're talking about 7 years of continuous code change and dynamic business logic. Sadly, there was barely enough technical documentation. To make things spicier, the technical stack is a little unique. Finally, the code base is not consistent since ESLint and Prettier were not properly set up.
I was going to enumerate how technically the app works, but all you need to know is that:
- We had AngularJS + VueJS, the first initializing some parts of the app while VueJS was integrated into other app pages.
- Too many dependencies and libraries.
After noticing that the app seemed to load after an eternity, I've suggested that we should play it safe by reducing the bundle size and page load time. I mean, what could go wrong?
Establishing a baseline 📈
The first thing you want to do is to establish a baseline. This is helpful to compare your results and know if you've improved things or made them worse. Since we were going to work on the bundle size, your safe bet is to look at the size of your dist folder (or whatever other output build folder). Next you can open for example the homepage, F12 to open the developer tools, choose the network tab, tick the "Disable cache" option and look for the network activity. Below an example with DuckDuckGo.
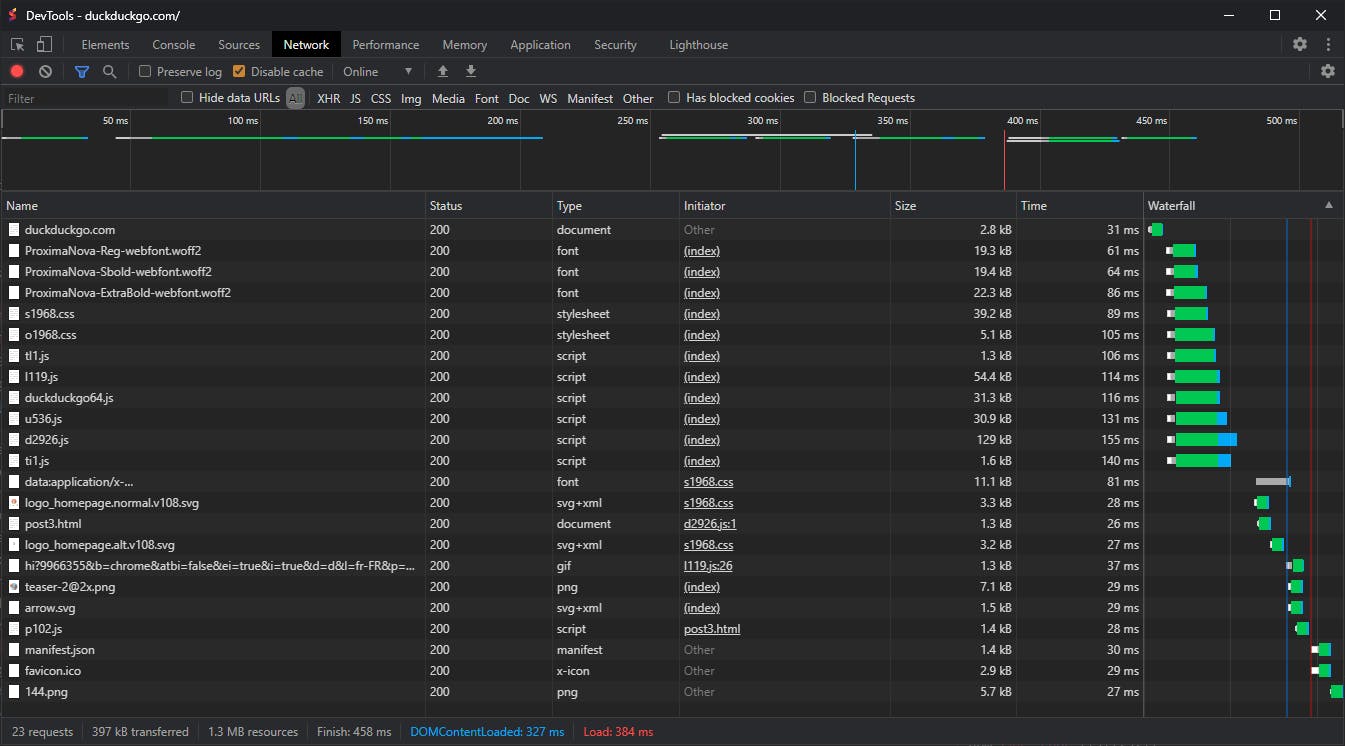
Note: You can click on each request and chose the "Timing" tab to understand what's happening.
As for right now, what's important is the lower bar that reads:
28 requests | 397 kB transferred | 1.3 MB resources | DOMContentLoaded: 327 ms | Load: 384 ms
What's important for now are the three first, the number of requests, the transferred data over the network, and the size of the resources loaded by the page.
We tried the same manipulation on our app and...🤯:
116 requests | 89 MB transferred | 156 MB resources
This was truly beyond my expectations! I checked the bundle size of the dist and it was just shy of 180 MB! So I started digging the webpack.config.js files.
One important tool will be webpack/analyse you just need to run webpack --profile --json > stats.json and upload this JSON to the web app, try the examples, it's awesome ⭐ !
Configuring and tweaking Webpack ⚙
It's not the first time I've configured Webpack for something very custom. I even made a simple Webpack, TypeScript and Scss boilerplate to help me kickstart a frontend project easily. This project though had one of the most convoluted Webpack configurations I've ever seen so. I'll break down this sub-section with the steps that we took for each configuration.
Minification 🗜
On its minification section Webpack recommends to use the TerserPlugin we used the example code as found in the docs and below:
const TerserPlugin = require("terser-webpack-plugin");

module.exports = {
  optimization: {
    minimize: true,
    minimizer: [new TerserPlugin()],
  },
};
Kicking off a build, it worked! I looked at a colleague and I said "Well that wasn't hard 😅". He suggested we check the app and see if everything works in the runtime. It didn't.
The app mainly couldn't get past the first loading screen because AngularJS couldn't load some of its dependencies. Since AngularJS was basically the first point of entry of the app, nothing worked. This was our first bummer.
We tried to investigate the problem but couldn't really find why it failed miserably. We put this problem in standby, disabled modification, and carried on to the next step.
Chunking/Code splitting 🧩
Chunking or Code Splitting is a very good approach since the entire application is a SPA with AngularJS and VueJS, if done right, we can avoid loading all unnecessary resources. We would load only what we need when we need it.
The good news is that VueJS supported some form of dynamic imports below a simple example:
/** Without dynamic imports **/
import AwesomeComponentfrom '@/modules/module1/components/AwesomeComponent.vue';
import DataVizComponent from '@/modules/module2/components/DataVizComponent.vue';

@Component({
  components: {
    AwesomeComponent,
    DataVizComponent,
  }
})
export default class extends Vue {
  // ...
}
/** With dynamic imports **/

// Method 2
const DataVizComponent = () => import('@/modules/module2/components/DataVizComponent.vue');

@Component({
  components: {
    // Method 1
    AwesomeComponent: () => import('@/modules/module1/components/AwesomeComponent.vue'),
    // Method 2
    DataVizComponent,
  }
})
export default class extends Vue {
  // ...
}
You'll notice I've demonstrated two methods but it really depends on your preference. What's important is that with this, Webpack will detect those dynamic imports and will create chunks that will be loaded only when the host component is loaded.
⚠ There is a catch! You have to do this with all the imports of your component; Say you want AwesomeComponent.vue to be loaded as a chunk, you'll have to look for all the components that are importing it and make a dynamic import. This can be seen as simple, but for big apps, this is a nightmare. You'll also have to test the app in runtime and make sure everything is in order. Usually, it will be, but better make sure!
Sourcemaps 📜
Sourcemaps serve only one thing; to help you easily debug your minified code. We've noticed that sourcemaps were generated with the parameter cheap-module-source-map but they were also generated for production. Sourcemaps are not loaded as long as you don't open your development tool. But they take valuable build time and resources. Plus as we work for a client that wants to keep its business secrets secure, it's best to disable it for production and keep it for develop.
For our needs, we altered the sourcemaps to be eval on the dev server (for fast builds and fast hot reloads) and disabled them for prod. This made us reduce our bundle size from 180 MB to around 100 MB, a big achievement 🎉.
Selective minification 🎛️
Back to our minification problem, it turns out you can tell the TerserPlugin to minify or ignore a specific chunk using its name. How about we minify everything aside from the chunk that contains the AngularJS project part?
minimizer: [
  new TerserPlugin({
    chunkFilter: (chunk) => {
      if (chunk.name === 'CONFIG CHUNK NAME') {
        return false;
      }

      return true;
    },
  }),
],
After a long build (minification impacts build time a lot!) we opened the app and it loaded, AngularJS didn't complain about it! 🎉
Benchmarking after the optimizations 📉
After almost a full year of optimizations, we compared our numbers:
Before optimizations 🟥
116 requests | 89 MB transferred | 156 MB resources
After optimizations 🟦
49 requests | 20.1 MB transferred | 20.4 MB resources
The pages load way faster compared to our baseline benchmarks and we still have room for improvement!
Note: We made benchmarks each month, but for the sake of simplicity I didn't include them.
Chunking helped us to go from 7 big main chunks (that were ironically loaded all at the same time) to 155 chunks! Keep in mind that this was a progressive work, below a chart that shows how it was done over time:
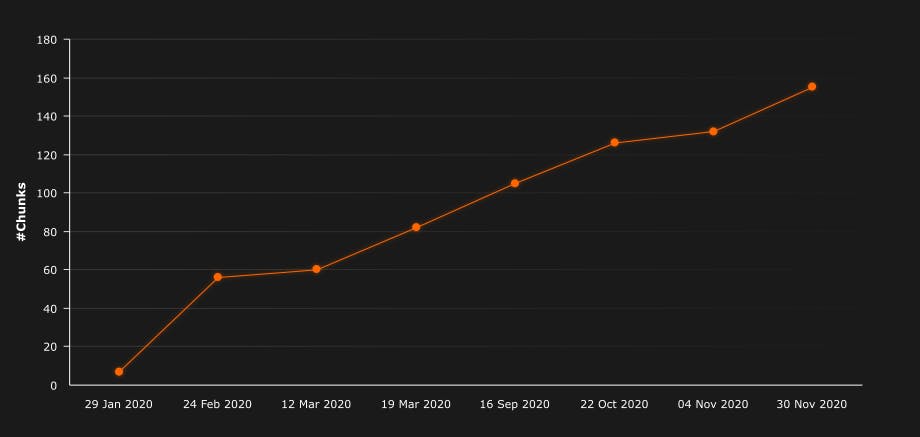
Finally, minification helped us to successfully generate a working bundle that's less than 90 MB ! 🎇
Wrap-up 📦
There are way more things I'd love to talk about but I feel that this article became way too long. In any case, I hope that this will be helpful for you. Again, if I made a mistake or forgot about something, please let me know. Don't be shy to chime in and tell me about your performance tricks too, I'd love to read them!
Cheers!